Very interesting examination, smokie. Makes me wonder if some operation involving the pivots, when done in reverse, would greatly improve the cycle scores.
I think the same but how? Could the extra physical gap between row 12 and 13 point to such an operation?
Also, position 234, the axis of the rightmost pivot, is the last position for quite a few cycles. 234 is a multiplier of 13, a number discussed in the coincidence count thread because there are some period 26 and 39 bigram repeats that repeat at a spacing of 78. All multipliers of 13. The axis of the leftmost pivot is of course also a multiplier of 13 because the pivots are on a period of 39. Very strange!
It is very strange.
I’m not sure if it was brought up in the coincidence thread but there seems to be a relation between (untransposed) periodical unigram repeats and kasiski examination offset counts. For instance, in the 340 periodical unigram repeats peak at 26 and kasiski offsets peak at 78 and 262. In the 408 periodical unigram repeats peak at 49 and kasiski offsets peaks at 49 and 359.
The periodical unigram repeat peak seems to be the determining base factor for the kasiski offset peaks. For example smokie1a has a periodical unigram repeat peak at 20 and kasiski offsets peak very highly at 120 and 220.
Smokie,
You just gave me an idea. You said that the axis point of the rightmost pivot is a multiplier of 13. But actually the axes of both pivots are multipliers of 39. First pivot is then 195 / 39 = 5. Second pivot is 234 / 39 = 6. Based on that they follow up on eachother: 5, 6.
Could that be something or is my nose too short. Why would it be that exactly both pivot axes points are multipliers of 39, coincidence?
doranchak,
Thanks for displaying the L2 and L3 stats for my cipher. The 340 is an uncanny collection of encoding stats. Perhaps your cipher type identification project will be able to shed more light on it.

Smokie,
You just gave me an idea. You said that the axis point of the rightmost pivot is a multiplier of 13. But actually the axes of both pivots are multipliers of 39. First pivot is then 195 / 39 = 5. Second pivot is 234 / 39 = 6. Based on that they follow up on eachother: 5, 6.
Could that be something or is my nose too short. Why would it be that exactly both pivot axes points are multipliers of 39, coincidence?
Wow that is very interesting. I counted going RLTB, LRBT and RLBT and did not find exact multipliers of 29 or 39. Maybe coincidence, maybe not. I think it is cool that we found another interesting fact about the pivots.

Smokie,
You just gave me an idea. You said that the axis point of the rightmost pivot is a multiplier of 13. But actually the axes of both pivots are multipliers of 39. First pivot is then 195 / 39 = 5. Second pivot is 234 / 39 = 6. Based on that they follow up on eachother: 5, 6.
Could that be something or is my nose too short. Why would it be that exactly both pivot axes points are multipliers of 39, coincidence?
I haven’t noticed that before. Fascinating observation. I have added it here – please let me know if you are OK with the attribution: http://zodiackillerciphers.com/wiki/ind … 2Pivots.22
I wanted to see what all the multipliers of 39 looked like in the cipher text, so here’s an illustration (they are marked in boldface):

The other multipliers of 13 are highlighted in green.
I haven’t noticed that before. Fascinating observation. I have added it here – please let me know if you are OK with the attribution:
It’s okay, thanks for informing me.
Smokie,
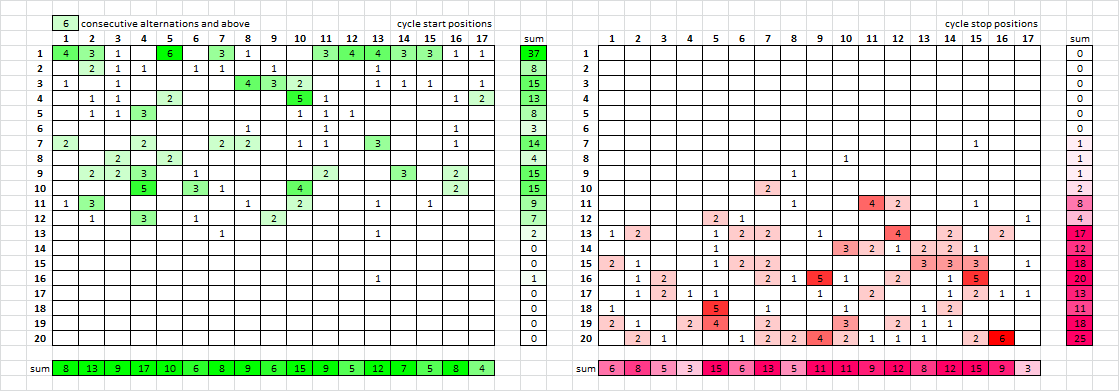
I tried to stack your images with photoshop to perhaps draw out a structure or pattern but it doesn’t come out so well. Do you think you could do that with your spreadsheet? If possible I would also like to see totals for rows and columns. I guess it would be better to keep the start and ends seperated.

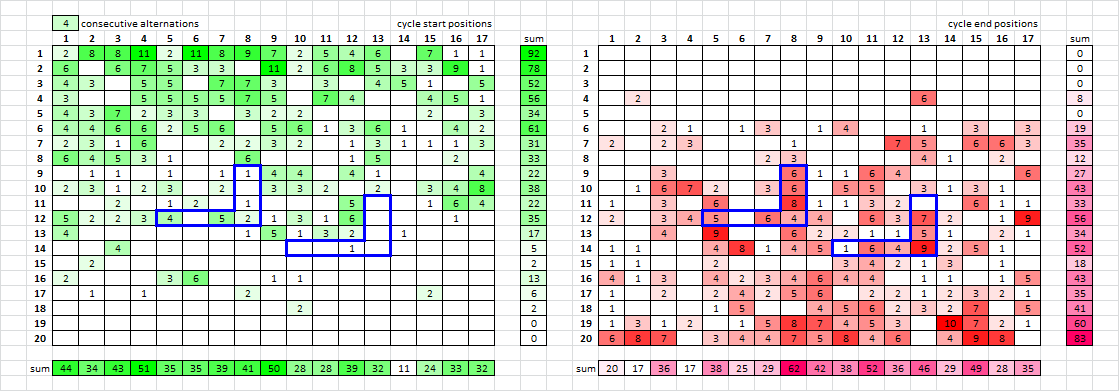
I made an edit to one of the above posts because I may have caused a misunderstanding. If I am showing 4 consecutive alternations, then that includes 5, 6, 7, 8, 9, 10, 11, 12 and 13 also. They are stacked. But if you want to see one in particular or a range in particular, I can easily change the formulas and show them. I can go to 3 consecutive alternations, i.e. ABAB if you want as well.
Summing the rows and columns was a good idea. Not very many cycles start in column 14, and a lot of cycles stop in column 8, one of the pivot columns.
Now that I think of it, it may not be a bad idea to draft these into different column counts to see if there is a pattern in a different orientation… I can work on that soon if you don’t beat me to it.
Cycle starts ( 4 CA and above ):
2 8 8 11 2 11 8 9 7 2 5 4 6 0 7 1 1
6 0 6 7 5 3 3 0 11 2 6 8 5 3 3 9 1
4 3 0 5 5 0 7 7 3 0 3 0 4 5 1 0 5
3 0 0 5 5 5 5 7 5 0 7 4 0 0 4 5 1
4 3 7 2 3 3 0 3 2 2 0 0 0 0 2 0 3
4 4 6 6 2 5 6 0 5 6 1 3 6 1 0 4 2
2 3 1 6 0 0 2 2 3 2 0 1 3 1 1 1 3
6 4 5 3 1 0 0 6 0 0 0 1 5 0 0 2 0
0 1 1 0 1 0 1 1 4 4 0 4 1 0 0 0 4
2 3 1 2 3 0 2 0 3 3 2 0 2 0 3 4 8
0 0 2 0 1 2 0 1 0 0 0 5 0 0 1 6 4
5 2 2 3 4 0 5 2 1 3 1 6 0 0 0 1 0
4 0 0 0 0 0 0 1 5 1 3 2 0 1 0 0 0
0 0 4 0 0 0 0 0 0 0 0 1 0 0 0 0 0
0 2 0 0 0 0 0 0 0 0 0 0 0 0 0 0 0
2 0 0 0 3 6 0 0 1 1 0 0 0 0 0 0 0
0 1 0 1 0 0 0 2 0 0 0 0 0 0 2 0 0
0 0 0 0 0 0 0 0 0 2 0 0 0 0 0 0 0
0 0 0 0 0 0 0 0 0 0 0 0 0 0 0 0 0
0 0 0 0 0 0 0 0 0 0 0 0 0 0 0 0 0
Cycle stops ( 4 CA and above ):
0 0 0 0 0 0 0 0 0 0 0 0 0 0 0 0 0
0 0 0 0 0 0 0 0 0 0 0 0 0 0 0 0 0
0 0 0 0 0 0 0 0 0 0 0 0 0 0 0 0 0
0 2 0 0 0 0 0 0 0 0 0 0 6 0 0 0 0
0 0 0 0 0 0 0 0 0 0 0 0 0 0 0 0 0
0 0 2 1 0 1 3 0 1 4 0 0 1 0 3 0 3
2 0 2 3 0 0 0 1 0 0 0 7 5 0 6 6 3
0 0 0 0 0 0 2 3 0 0 0 0 4 1 0 2 0
0 0 3 0 0 0 0 6 1 1 6 4 0 0 0 0 6
0 1 6 7 2 0 3 6 0 5 5 0 3 1 3 1 0
1 0 3 0 6 0 0 8 1 1 3 2 0 0 6 1 1
2 0 3 4 5 0 6 4 4 0 6 3 7 2 0 1 9
0 0 4 0 9 0 0 6 2 2 1 1 5 1 0 2 1
1 1 0 0 4 8 1 4 5 1 6 4 9 2 5 1 0
1 1 0 0 2 0 0 0 0 3 4 2 1 3 0 1 0
4 1 3 0 4 2 3 4 6 4 4 0 1 1 0 1 5
1 0 2 0 2 4 2 5 6 0 2 2 1 2 3 2 1
1 0 0 0 1 5 0 0 4 5 6 2 3 2 7 0 5
1 3 1 2 0 1 5 8 7 4 5 3 0 10 7 2 1
6 8 7 0 3 4 4 7 5 8 4 6 0 4 9 8 0
I am working on the other two messages and my incomplete inscription rectangle detection spreadsheet. The one with the incomplete inscription rectangle, is the difference in rows only 1?
I made an edit to one of the above posts because I may have caused a misunderstanding. If I am showing 4 consecutive alternations, then that includes 5, 6, 7, 8, 9, 10, 11, 12 and 13 also. They are stacked. But if you want to see one in particular or a range in particular, I can easily change the formulas and show them. I can go to 3 consecutive alternations, i.e. ABAB if you want as well.
Okay.
Summing the rows and columns was a good idea. Not very many cycles start in column 14, and a lot of cycles stop in column 8, one of the pivot columns.
That loosely seems to confirm my removal tests. While removing any combinations of 2 rows OR columns, the pivot rows and columns returned the highest encoding score. Even when considering smaller fragments allot of the time they converge on the pivots. I don’t know what to make of it, but it may be a sick coincidence.
Now that I think of it, it may not be a bad idea to draft these into different column counts to see if there is a pattern in a different orientation… I can work on that soon if you don’t beat me to it.
I probably want to automate something like that sometime, but not now so I’ll wait for your analysis. I’m working mainly on an AZdecrypt update now.
I am working on the other two messages and my incomplete inscription rectangle detection spreadsheet. The one with the incomplete inscription rectangle, is the difference in rows only 1?
I interpreted that as the inscription rectangle occupying more than 340 characters. The difference is less than 1 row.
The inscription rectangle is incomplete, or irregular, also.
K I access the site from two locations, so posting some info that I can pull up later:
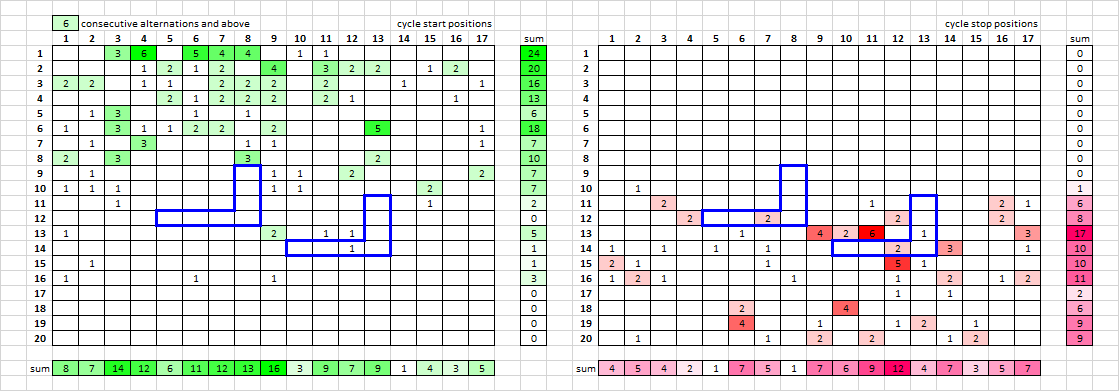
6 CA and above, more likely true, showing a lot of cycles stop on pivot rows, and start and stop on column 9 the center column.
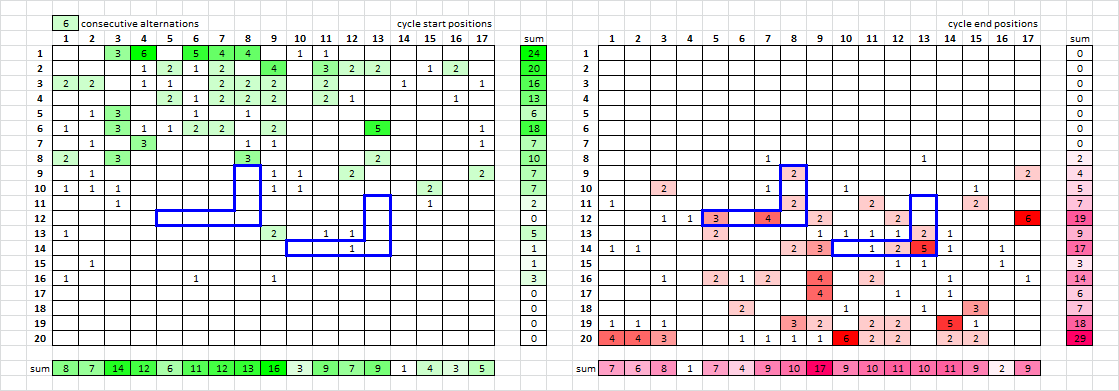
Cycle starts ( 6 CA and above ):
0 0 3 6 0 5 4 4 0 1 1 0 0 0 0 0 0
0 0 0 1 2 1 2 0 4 0 3 2 2 0 1 2 0
2 2 0 1 1 0 2 2 2 0 2 0 0 1 0 0 1
0 0 0 0 2 1 2 2 2 0 2 1 0 0 0 1 0
0 1 3 0 0 1 0 1 0 0 0 0 0 0 0 0 0
1 0 3 1 1 2 2 0 2 0 0 0 5 0 0 0 1
0 1 0 3 0 0 0 1 1 0 0 0 0 0 0 0 1
2 0 3 0 0 0 0 3 0 0 0 0 2 0 0 0 0
0 1 0 0 0 0 0 0 1 1 0 2 0 0 0 0 2
1 1 1 0 0 0 0 0 1 1 0 0 0 0 2 0 0
0 0 1 0 0 0 0 0 0 0 0 0 0 0 1 0 0
0 0 0 0 0 0 0 0 0 0 0 0 0 0 0 0 0
1 0 0 0 0 0 0 0 2 0 1 1 0 0 0 0 0
0 0 0 0 0 0 0 0 0 0 0 1 0 0 0 0 0
0 1 0 0 0 0 0 0 0 0 0 0 0 0 0 0 0
1 0 0 0 0 1 0 0 1 0 0 0 0 0 0 0 0
0 0 0 0 0 0 0 0 0 0 0 0 0 0 0 0 0
0 0 0 0 0 0 0 0 0 0 0 0 0 0 0 0 0
0 0 0 0 0 0 0 0 0 0 0 0 0 0 0 0 0
0 0 0 0 0 0 0 0 0 0 0 0 0 0 0 0 0
Cycle stops ( 6 CA and above ):
0 0 0 0 0 0 0 0 0 0 0 0 0 0 0 0 0
0 0 0 0 0 0 0 0 0 0 0 0 0 0 0 0 0
0 0 0 0 0 0 0 0 0 0 0 0 0 0 0 0 0
0 0 0 0 0 0 0 0 0 0 0 0 0 0 0 0 0
0 0 0 0 0 0 0 0 0 0 0 0 0 0 0 0 0
0 0 0 0 0 0 0 0 0 0 0 0 0 0 0 0 0
0 0 0 0 0 0 0 0 0 0 0 0 0 0 0 0 0
0 0 0 0 0 0 1 0 0 0 0 0 1 0 0 0 0
0 0 0 0 0 0 0 2 0 0 0 0 0 0 0 0 2
0 0 2 0 0 0 1 0 0 1 0 0 0 0 1 0 0
1 0 0 0 0 0 0 2 0 0 2 0 0 0 2 0 0
0 0 1 1 3 0 4 0 2 0 0 2 0 0 0 0 6
0 0 0 0 2 0 0 0 1 1 1 1 2 1 0 0 0
1 1 0 0 0 0 0 2 3 0 1 2 5 1 0 1 0
0 0 0 0 0 0 0 0 0 0 0 1 1 0 0 1 0
0 0 1 0 2 1 2 0 4 0 2 0 0 1 0 0 1
0 0 0 0 0 0 0 0 4 0 0 1 0 1 0 0 0
0 0 0 0 0 2 0 0 0 1 0 0 1 0 3 0 0
1 1 1 0 0 0 0 3 2 0 2 2 0 5 1 0 0
4 4 3 0 0 1 1 1 1 6 2 2 0 2 2 0 0
7 CA and above ( ABABABAB ) more likely true:
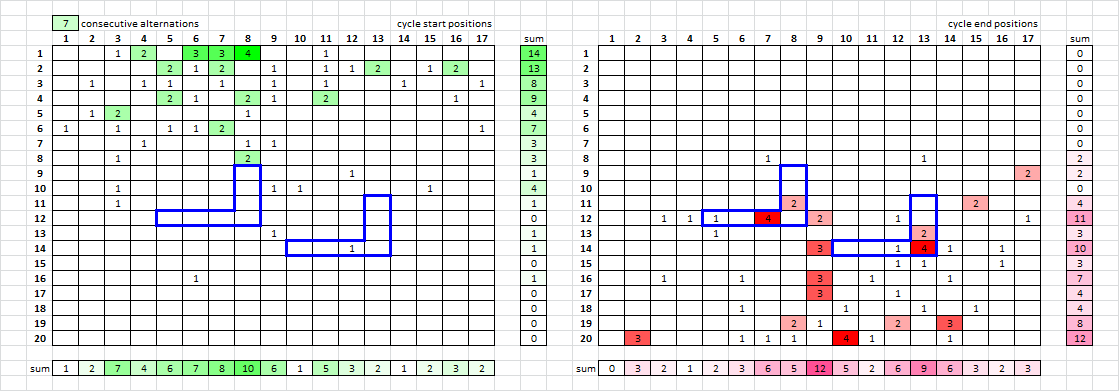
Cycle starts ( 7 CA and above ):
0 0 1 2 0 3 3 4 0 0 1 0 0 0 0 0 0
0 0 0 0 2 1 2 0 1 0 1 1 2 0 1 2 0
0 1 0 1 1 0 1 0 1 0 1 0 0 1 0 0 1
0 0 0 0 2 1 0 2 1 0 2 0 0 0 0 1 0
0 1 2 0 0 0 0 1 0 0 0 0 0 0 0 0 0
1 0 1 0 1 1 2 0 0 0 0 0 0 0 0 0 1
0 0 0 1 0 0 0 1 1 0 0 0 0 0 0 0 0
0 0 1 0 0 0 0 2 0 0 0 0 0 0 0 0 0
0 0 0 0 0 0 0 0 0 0 0 1 0 0 0 0 0
0 0 1 0 0 0 0 0 1 1 0 0 0 0 1 0 0
0 0 1 0 0 0 0 0 0 0 0 0 0 0 0 0 0
0 0 0 0 0 0 0 0 0 0 0 0 0 0 0 0 0
0 0 0 0 0 0 0 0 1 0 0 0 0 0 0 0 0
0 0 0 0 0 0 0 0 0 0 0 1 0 0 0 0 0
0 0 0 0 0 0 0 0 0 0 0 0 0 0 0 0 0
0 0 0 0 0 1 0 0 0 0 0 0 0 0 0 0 0
0 0 0 0 0 0 0 0 0 0 0 0 0 0 0 0 0
0 0 0 0 0 0 0 0 0 0 0 0 0 0 0 0 0
0 0 0 0 0 0 0 0 0 0 0 0 0 0 0 0 0
0 0 0 0 0 0 0 0 0 0 0 0 0 0 0 0 0
Cycle stops ( 7 CA and above ):
0 0 0 0 0 0 0 0 0 0 0 0 0 0 0 0 0
0 0 0 0 0 0 0 0 0 0 0 0 0 0 0 0 0
0 0 0 0 0 0 0 0 0 0 0 0 0 0 0 0 0
0 0 0 0 0 0 0 0 0 0 0 0 0 0 0 0 0
0 0 0 0 0 0 0 0 0 0 0 0 0 0 0 0 0
0 0 0 0 0 0 0 0 0 0 0 0 0 0 0 0 0
0 0 0 0 0 0 0 0 0 0 0 0 0 0 0 0 0
0 0 0 0 0 0 1 0 0 0 0 0 1 0 0 0 0
0 0 0 0 0 0 0 0 0 0 0 0 0 0 0 0 2
0 0 0 0 0 0 0 0 0 0 0 0 0 0 0 0 0
0 0 0 0 0 0 0 2 0 0 0 0 0 0 2 0 0
0 0 1 1 1 0 4 0 2 0 0 1 0 0 0 0 1
0 0 0 0 1 0 0 0 0 0 0 0 2 0 0 0 0
0 0 0 0 0 0 0 0 3 0 0 1 4 1 0 1 0
0 0 0 0 0 0 0 0 0 0 0 1 1 0 0 1 0
0 0 1 0 0 1 0 0 3 0 1 0 0 1 0 0 0
0 0 0 0 0 0 0 0 3 0 0 1 0 0 0 0 0
0 0 0 0 0 1 0 0 0 1 0 0 1 0 1 0 0
0 0 0 0 0 0 0 2 1 0 0 2 0 3 0 0 0
0 3 0 0 0 1 1 1 0 4 1 0 0 1 0 0 0
6 CA and above, more likely true, showing a lot of cycles stop on pivot rows, and start and stop on column 9 the center column.
Very interesting, but what to make of it?
I’ve created a cipher with 2 filler rows and a randomized plaintext. Can you draw out the rows using only the cycle start and stop positions? I also like to know how it would look and compare to the 340 with your spreadsheet cycle start and stop visuals. Ofcourse, take your time, I guess by now you have plenty of work queued.
1 2 3 4 5 6 7 8 9 10 11 12 13 14 15 16 17
9 18 19 7 20 21 22 23 24 25 5 26 27 28 29 30 19
31 32 23 3 33 34 28 35 36 12 37 38 38 1 6 39 15
40 41 42 43 38 19 23 44 16 44 19 33 45 46 3 34 47
48 11 40 42 31 49 50 32 51 16 23 49 2 33 22 20 33
10 52 53 54 26 8 6 17 27 55 33 28 13 56 57 33 10
21 51 28 40 33 19 28 1 36 10 5 35 44 58 23 18 6
59 38 19 2 33 14 23 51 30 6 60 3 4 7 12 22 26
24 40 19 22 37 49 43 16 3 58 23 53 42 6 55 26 13
49 11 27 19 43 16 2 15 38 22 47 1 26 59 40 28 10
21 23 48 8 31 41 9 33 6 9 5 27 28 11 33 42 36
9 44 34 19 38 2 17 31 22 61 18 14 52 26 27 23 21
2 5 17 35 38 43 33 47 3 41 13 44 38 18 51 15 3
4 51 43 52 7 6 3 12 37 1 36 16 15 19 28 3 62
35 1 60 38 37 5 23 56 57 24 41 59 14 22 6 58 40
33 44 21 5 15 17 28 58 18 24 18 33 58 49 23 34 16
23 47 52 33 6 2 29 32 35 57 11 9 51 52 42 28 7
22 10 33 63 19 26 11 58 11 21 53 23 27 14 6 39 28
12 37 3 7 19 38 1 20 23 16 49 36 6 8 58 45 40
19 9 38 25 31 58 42 44 47 2 10 31 5 63 34 22 33
Something I’ve been thinking of lately is a new analysis direction, simply put, merging symbols (assuming cycles) and see what happens statisticly. I decided to merge the 2-symbol cycle "2z" after running a 10 row slide through the 340 looking for perfect cycles. The "2z" cycle shows up 2 times here.
1 to 10: total score: 2176 - #*#*#*#*#: 56
2 to 11: total score: 2190 - OKOKOKOKOKO: 90
3 to 12: total score: 1800 - MJMJMJMJM: 56
4 to 13: total score: 1750 - 3+3+3+3+3: 56
5 to 14: total score: 1832 - 8585858585: 72
6 to 15: total score: 1579 - R2R2R2R2R2: 72
7 to 16: total score: 1354 - 2z2z2z2z2z2: 90
8 to 17: total score: 1592 - 2z2z2z2z2: 56
9 to 18: total score: 1316 - <^<^<^<^: 42
10 to 19: total score: 1420 - +7+7+7+7+: 56
11 to 20: total score: 1676 - RMRMRMRM: 42
Then I looked at periodical bigram repeats and found something interesting that I don’t know what to make of it. I want to consider it a loose observation for now. On top you have the transposed periodical bigram repeats with a peak at 18 (this is similar to untransposed period 19 btw). And on the bottom it is the same with "2z" merged into 1 symbol (cycle assumed). After doing that transposed period 78 peaks with 39 bigram repeats.
There is also a bump around transposed period 78, something I’ve noticed earlier but don’t know what to make of it.

6 CA and above, more likely true, showing a lot of cycles stop on pivot rows, and start and stop on column 9 the center column.
Very interesting, but what to make of it?
I’ve created a cipher with 2 filler rows and a randomized plaintext. Can you draw out the rows using only the cycle start and stop positions? I also like to know how it would look and compare to the 340 with your spreadsheet cycle start and stop visuals. Ofcourse, take your time, I guess by now you have plenty of work queued.
1 2 3 4 5 6 7 8 9 10 11 12 13 14 15 16 17
9 18 19 7 20 21 22 23 24 25 5 26 27 28 29 30 19
31 32 23 3 33 34 28 35 36 12 37 38 38 1 6 39 15
40 41 42 43 38 19 23 44 16 44 19 33 45 46 3 34 47
48 11 40 42 31 49 50 32 51 16 23 49 2 33 22 20 33
10 52 53 54 26 8 6 17 27 55 33 28 13 56 57 33 10
21 51 28 40 33 19 28 1 36 10 5 35 44 58 23 18 6
59 38 19 2 33 14 23 51 30 6 60 3 4 7 12 22 26
24 40 19 22 37 49 43 16 3 58 23 53 42 6 55 26 13
49 11 27 19 43 16 2 15 38 22 47 1 26 59 40 28 10
21 23 48 8 31 41 9 33 6 9 5 27 28 11 33 42 36
9 44 34 19 38 2 17 31 22 61 18 14 52 26 27 23 21
2 5 17 35 38 43 33 47 3 41 13 44 38 18 51 15 3
4 51 43 52 7 6 3 12 37 1 36 16 15 19 28 3 62
35 1 60 38 37 5 23 56 57 24 41 59 14 22 6 58 40
33 44 21 5 15 17 28 58 18 24 18 33 58 49 23 34 16
23 47 52 33 6 2 29 32 35 57 11 9 51 52 42 28 7
22 10 33 63 19 26 11 58 11 21 53 23 27 14 6 39 28
12 37 3 7 19 38 1 20 23 16 49 36 6 8 58 45 40
19 9 38 25 31 58 42 44 47 2 10 31 5 63 34 22 33
Here is what it looks like with 6 CA and above. It doesn’t seem to show any definitive rows as filler. But it shows the last position of a cycle, and not the symbol after a true cycle. In other words, ABABB would show the position of the second B, but not the last B. So maybe that is part of the issue; perhaps I could modify it.
It looks like a lot of cycles begin on rows 7, 9 and 10. A lot of cycles end on rows 13, 15 and 16. But nothing definitive.
K I modified the spreadsheet so that instead of showing the stop position of a cycle, it shows the position of the symbol that stops or breaks the cycle. In other words, the position of the last B in ABABB instead of the second to last B. But if the cycle ends perfectly, then the position is not counted. In other words, ABBABAB would not register on the stop side.
Maybe your filler rows are rows 13 and 16. This is for the message that you posted just above.
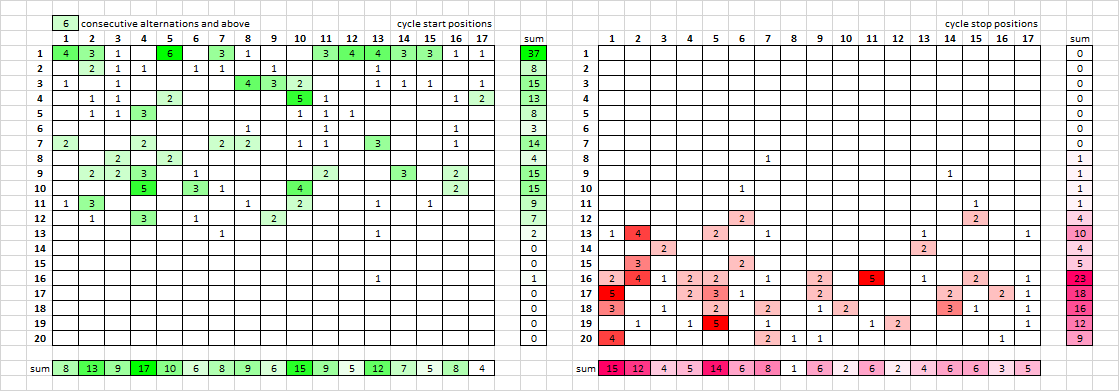
And for the 340, the row in between the pivots, row 13, is highest for symbols that break a cycle.