
COOL!!!
I just drafted the 340 into 19 columns and marked the pivot symbols. This seems to isolate the horizontal part of the rightmost pivot a little bit.
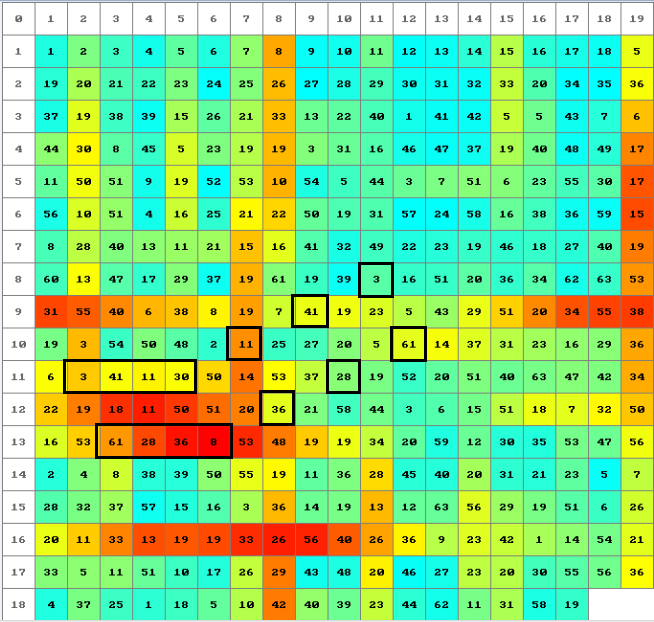

That isolation of the second pivot is also there in 17 by 20.
Maps 1 to 3 offer the most accurate color to randomization mapping while on the bad side the fragments are very rough. Map 4 always normalizes the randomization range over teal and red so that color to randomization mapping is not accurate while on the good side the fragments may be more detailed.
Also, normalization for the grid test between different cipher dimensions is not perfect and vertical fragments may feed of horizontal fragments and vice versa. In extreme situations the test may show excessive artifacts.
Here is removal of rows versus my perfect 4-symbol cycle score. Removing row 14 seems especially beneficial to higher n-symbol cycles and many short length cycles appear. Perhaps higher n-symbol cycle scores inflate more rapidly:
row 1: 120
row 2: 274
row 3: 20
row 4: 20
row 5: 200
row 6: 542
row 7: 20
row 8: 340
row 9: 192
row 10: 120
row 11: 534
row 12: 100
row 13: 270
row 14: 1444 <---
row 15: 90
row 16: 0
row 17: 200
row 18: 216
row 19: 270
row 20: 578
340:
AZdecrypt perfect 4-symbol cycles stats for: 340.txt
----------------------------------------------------
Index of coincidence:
- Raw: 120
- Normalized: 0.00105977108944468
- Flatness: 0.9900000000000002
Cycles: 5
Average cycle length: 5.4

Cycles by appearance:
----------------------------------------------------
P%:3P%:3P (30)
1:3q1:3q1 (30)
%:3q%:3q (20)
%j&q%j&q (20)
:3qA:3qA (20)
340 row 14 removed:
AZdecrypt perfect 4-symbol cycles stats for: 340.txt
----------------------------------------------------
Index of coincidence:
- Raw: 1444
- Normalized: 0.01414576802507837
- Flatness: 0.9386149584487534
Cycles: 25
Average cycle length: 7.88

Cycles by appearance:
----------------------------------------------------
>f7t>f7t>f7t> (90)
>Z7t>Z7t>Z7t>Z (110)
P%:3P%:3P (30)
1:3q1:3q1 (30)
NZ7tNZ7tNZ7tNZ (110)
%:3q%:3q (20)
%j&q%j&q (20)
Df7tDf7tDf7tD (90)
DZ7tDZ7tDZ7tDZ (110)
YZ7tYZ7tYZ7tYZ (110)
f7t&f7t&f7t (56)
f7t;f7t;f7t; (72)
f7tXf7tXf7t (56)
f7&Xf7&Xf7 (42)
f7;Xf7;Xf7; (56)
f_&Xf_&Xf_ (42)
f_;Xf_;Xf_; (56)
ft&Xft&Xft (42)
ft;Xft;Xft; (56)
fj&Xfj&Xf (30)
f/;Xf/;Xf/; (56)
:3qA:3qA (20)
7t&q7t&q7t (42)
7t&X7t&X7t (42)
7t;X7t;X7t; (56)

Wow, nice findings. The deletion is row 14 is fascinating.
I reproduced the cycle improvement effect in my own test (note my row numberings start at 0):
https://docs.google.com/spreadsheets/d/ … sp=sharing
It’s interesting that deleting row 14 doesn’t maximize my L=2 score but does for L=3 and L=4.
I am very curious about approaching this from another angle:
1) Generate all sequences for all selections of L symbols (example: ABCDABCDBBACABCD)
2) Determine the best possible symbol deletions from each sequence (example: From above, remove BBAC to produce ABCDABCDABCD)
3) Track the position of each deletion, based on how much it improves the sequence
4) Collect statistics about where the best deletions are happening
The reason is because I’m wondering if there’s something more fine-grained going on besides "one row of filler".
I did a test of all start/stop positions, removing the substring defined by [start,stop] then running my L=2 perfect cycles measurement. The peak occurs when deleting the substring starting at position 166 and ending at position 194 (position numbers start at zero). This causes the Z340’s L=2 cycle score to jump from 247.85 to 327.08.
The section removed is:
FBy-U+R/5tE|DYBpbTMKO2<clRJ|

It includes part of one of the pivots. By contrast, the best row deletion I found was deleting row 6 which caused the score to jump from 247.85 to 289.67.
Jarlve, is this consistent with what you are finding for L=2?
I updated my spreadsheet to show Top 1000 cycles for L={2,3,4,5}, comparing Z340 to the version with Row 14 removed. Click through the tabs at the bottom of the spreadsheet to see them.
https://docs.google.com/spreadsheets/d/ … sp=sharing
You can see for L=5 that removing row 14 doubles the number of "run=3" cycles that appear. A run is an unbroken sequence of cycles, so "run=3" would be something like ABCDE ABCDE ABCDE.
I’m trying to generate L=6 and L=7; hopefully my computer won’t die. ![]()
I experimented with the new detection program 2L randomizations, and five of the library messages. For each of the five messages, I made a message with
PC = perfect cycles
PCP = perfect cycles with pivot symbols out of cycle sequence, same locations as the 340
TPC = transposed at period 20 with perfect cycles ( to see what happens when natural plaintext cycles are disrupted )
TPCP = transposed at period 20 with perfect cycles and pivot symbols out of cycle sequence same locations as the 340
Example: 29PC is message 29 perfect cycles, 29PCP is message 29 perfect cycles with pivots, 29 TPC is message 29 transposed perfect cycles, and 29 TPCP is message 29 transposed perfect cycles with pivots.
The idea was to see how the new detection program works. I used map 3 to compare. The regular versus the transposed weren’t much different. The heatmap shows the general area of the pivots. The program works for perfect cycles, and it seems like cycle disruptions cause the program to detect other false cycle disruptions in the general area.
https://drive.google.com/drive/folders/ … XI2cTFrZGM
Wow, nice findings. The deletion is row 14 is fascinating.
I reproduced the cycle improvement effect in my own test (note my row numberings start at 0):
https://docs.google.com/spreadsheets/d/ … sp=sharing
It’s interesting that deleting row 14 doesn’t maximize my L=2 score but does for L=3 and L=4.
I am very curious about approaching this from another angle:
1) Generate all sequences for all selections of L symbols (example: ABCDABCDBBACABCD)
2) Determine the best possible symbol deletions from each sequence (example: From above, remove BBAC to produce ABCDABCDABCD)
3) Track the position of each deletion, based on how much it improves the sequence
4) Collect statistics about where the best deletions are happeningThe reason is because I’m wondering if there’s something more fine-grained going on besides "one row of filler".
Your approach looks promising. Something else has to be going on besides row 14 but it could be half the answer. Considering row 14 as filler is an assumption I have not wanted to make yet, it could just be very random or possibly an artifact of something else. Also, is it exactly row 14 or a smaller or larger fragment? Hard questions I have not been able to answer for now.
Jarlve, is this consistent with what you are finding for L=2?
It seems mostly consistent yes. Removing your fragment 166-194 gives a perfect 2-symbol cycle score of 2090 for my system which is higher than removing row 14. Removing row 6 is not the highest but it is not low either and removing row 14 does very well for 3 and 4-symbol symbol cycle scores as your test confirmed.
340 rows removed:
1st value: perfect 2-symbol cycle score
2nd value: perfect 3-symbol cycle score
3rd value: perfect 4-symbol cycle score
-----------------------
base: 1576, 1060, 120
-----------------------
row 1: 1526, 1060, 120
row 2: 1542, 1382, 274
row 3: 1216, 458, 20
row 4: 1526, 1182, 20
row 5: 1148, 724, 200
row 6: 1736, 1572, 542
row 7: 1400, 580, 20
row 8: 1586, 1422, 340
row 10: 1460, 950, 120
row 11: 1516, 1748, 534
row 12: 1558, 888, 100
row 13: 1820, 1614, 270
row 14: 1990, 3054, 1444 <---
row 15: 1294, 698, 90
row 16: 1294, 1112, 0
row 17: 1438, 1142, 200
row 18: 1514, 1086, 216
row 19: 1474, 922, 270
row 20: 1676, 1596, 578
Something to take in consideration is the following. With the cycle hill climber project some pages back I noticed that especially the 340 was prone to generate many small cycles of nearly identical lengths. It could suggest that Zodiac did not include all letters in the homophonic substitution. We have noticed before that the more frequent occuring symbols do not cycle well. These could be 1:1 substitutes, polyphones or nulls.
I experimented with the new detection program 2L randomizations, and five of the library messages. For each of the five messages, I made a message with
PC = perfect cycles
PCP = perfect cycles with pivot symbols out of cycle sequence, same locations as the 340
TPC = transposed at period 20 with perfect cycles ( to see what happens when natural plaintext cycles are disrupted )
TPCP = transposed at period 20 with perfect cycles and pivot symbols out of cycle sequence same locations as the 340Example: 29PC is message 29 perfect cycles, 29PCP is message 29 perfect cycles with pivots, 29 TPC is message 29 transposed perfect cycles, and 29 TPCP is message 29 transposed perfect cycles with pivots.
The idea was to see how the new detection program works. I used map 3 to compare. The regular versus the transposed weren’t much different. The heatmap shows the general area of the pivots. The program works for perfect cycles, and it seems like cycle disruptions cause the program to detect other false cycle disruptions in the general area.
Thanks for doing this smokie. Knowing that pivots are small fragments I am very happy with these results. That must have taken quite some time to generate. You can convert these images to .png with MS Paint to save some space. Though I should do some work to let AZdecrypt output .png images by default. How do you share images in an album like that? It is neat.
Something else you can do is use the custom shape encoding randomization test and put a pivot shape in the output window. The shapes must be squared off with spaces for it to work.
   *
   *
   *
****
Ran a grid encoding randomization test on the 340 with 3-symbol cycles, weight 2 and 250 trials (these settings can be changed through the stats options menu under options).
340 map 1: https://drive.google.com/open?id=0B5r0r … WpsZzZmWEE
340 map 2: https://drive.google.com/open?id=0B5r0r … UNyeU1PQWM
340 map 3: https://drive.google.com/open?id=0B5r0r … WE4emZ2QVk
340 map 4: https://drive.google.com/open?id=0B5r0r … npqazU1WVk
My perfect cycle score for L=3 on the unmodified Z340 is 62.36.
With row 14 removed, it jumps to 106.56.
It jumps even more to 140.79 when deleting the section starting at position 220 and ending at position 245 (numbered starting with zero).

It was the highest scoring of all my tests of start positions between 179 and 263, and end positions between 196 and 280. Full results here:
https://docs.google.com/spreadsheets/d/ … sp=sharing
L=3 cycles are included in that spreadsheet in other tabs.
Here is the effect on cycle counts, organized by number of runs (ABC ABC = run of 2; ABC ABC ABC = run of 3, etc):
Cipher: Run 5, Run 4, Run 3, Run 2, Total
Z340: 0, 11, 161, 3596, 3768
Z340 with [220-245] removed: 1, 4, 192, 3529, 3726
The deleted section caused a run of 5 to appear but lowered the number of runs of 4. However, runs of 3 went up from 161 to 192.
Thanks for doing this smokie. Knowing that pivots are small fragments I am very happy with these results. That must have taken quite some time to generate. You can convert these images to .png with MS Paint to save some space. Though I should do some work to let AZdecrypt output .png images by default. How do you share images in an album like that? It is neat.
I have a gmail account. I clicked on "Drive" which has a symbol that looks like a recycle triangle. Then I made a folder, pasted the files into the folder and pasted the link onto this site.
What about row 18? It looks pretty warm in the tests as well. And when I do just the top half, rows 4, 6 and 10 are warm.
All even rows smokie. 4,6,10,14,18
I have a gmail account. I clicked on "Drive" which has a symbol that looks like a recycle triangle. Then I made a folder, pasted the files into the folder and pasted the link onto this site.
What about row 18? It looks pretty warm in the tests as well. And when I do just the top half, rows 4, 6 and 10 are warm.
Ahhh… maps can be linked too. Thank you.
Made a horizontal specific slide test and here are the results, these should be a more accurate than what the grid and periodic tests can do for horizontal fragments: https://drive.google.com/open?id=0B5r0r … HhaNDFBdzQ
