Hi Smokie… Silly question time…
What is your definition of a "shuffle" you and David mention it often but i am assume the following
PT is based on Random chars which are then keyed with 63 symbol homophonic randomly is this correct?
We just randomly re-organize the 340. Or scramble it. I just re-draft the message into a 340 column x 1 row grid, generate a random number for each ciphertext, sort by the random number, and then re-draft again into a 17 x 20 grid.
I think that we use a shuffle test before anything else because it is very quick and easy to do, and we want to determine whether we should take a closer look at any particular phenomenon. The combination Vigenere homophonic message that I made for you had spikes at increments of 12. How many times would you have to shuffle that message to get such spikes at any increment? Probably a lot, so if you didn’t actually know what kind of a message it was you would think that the spikes may be evidence of the cipher and need to be further investigated. Doranchak shuffled the 340 one million times and there were only 2,782 spikes ( 0.28% ) at 18 or higher, so we are taking a closer look. Personally I think that the shuffle test has only so much value. But I think that it is a tool of economy. People have tried so many different theories on the 340 and none of them have so far worked. I think that doranchak is using the shuffle test to start with because he wants to use his time as efficiently as possible.
In the following
score = ln ( 1 / ( ( ( symbol count / 340 ) * ( symbol count / 340 ) ) ^ number of repeats ) )
I assume Symbol count = 63?
I know natural log etc but what is the relevance to the equation?
Natural log (squared (chance) to the power of instances)
Symbol count is the count of a particular symbol. There are 24 of the + symbol ( my symbol 19 ), and four repeats. Four positions where a + symbol occurs 78 positions away from another + symbol. So the score is 21.25. But I shuffled the 340 for a while and found that with the + symbol it is very easy to duplicate four or more repeats with the +. One possible explanation for the spike is that the spike is created by the + symbol repeats alone. Without them, you wouldn’t have a spike. Maybe homophonic encoding just caused some of the + symbols to align themselves at intervals of 78 positions, and that is what you detected. I just shuffled the 340 six times and got four repeats for the + symbol at x = 10. The spike is 17, but that is easier to achieve than 18.
I am going to keep working on this for a while. I am thinking of some ideas to explain the period 78 unigram repeats and the period 19 bigram repeats as if they are both produced by the same combination cipher. I score the period 19 bigram repeats similarly, but you cannot shuffle the message and get a distribution of similar scores like you can with the period 78 unigram repeats.
Question for you: What about spikes at near but not perfect increments. Say 20, 41, 60, 81 and 100 for example. Can they still be considered clues that a message is Vigenere and has a key length of 20, even if the increments are not perfect?
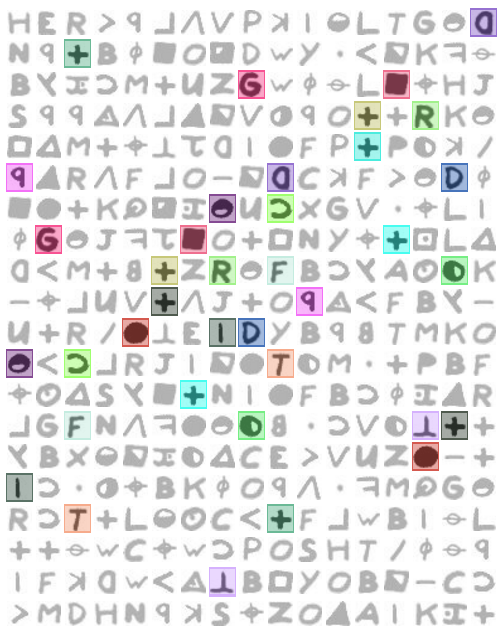
I would add to smokie’s comments that the shuffle test is best at identifying which phenomena really are happening purely by chance (for example, the Jazzerman patterns). It’s such an easy test to implement, so it’s a bit of "low hanging fruit". Where things get difficult, however, is making conclusions when the test suggests phenomena are rare. For example, you could say that the string "HER>pl^VPk" is rare because it seldom or never comes up in shuffles. But the number of similarly rare strings is astronomical. So the fact that we saw one rare example doesn’t mean much. Here you have a case of a specific very rare pattern representing a very common category. So when we say, "the pivots are very rare", could they possibly belong to a very common category of similarly interesting patterns that appear in shuffles but we just aren’t looking for them?
Because of that difficulty, I’ve moved away from making overly conclusive statements about things we observe in the Z340. To me it is better to collect all the interesting observations and compare them to examples from known encipherment schemes. And the observations themselves help guide the search for potential encipherment schemes (hopefully).
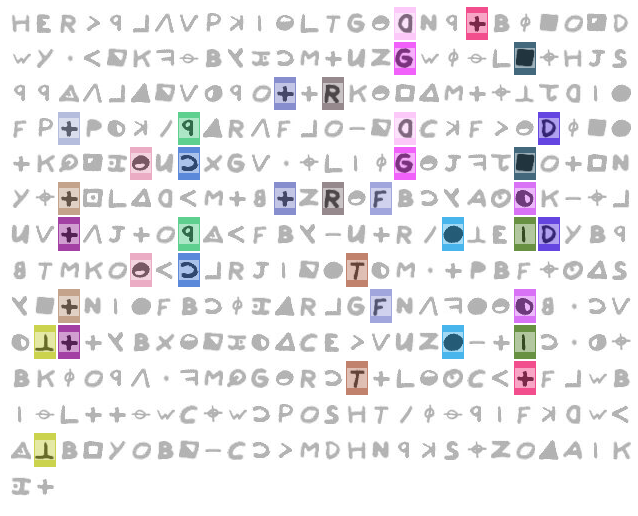
David there is a wrap over which i think you are missing (Pair 19 @, 281,19)
Ah – thanks for pointing it out. Here is another attempt to visualize where they appear.
To get from one symbol to its repeat, we can use the rule "move left 7 positions, then down 5 positions".
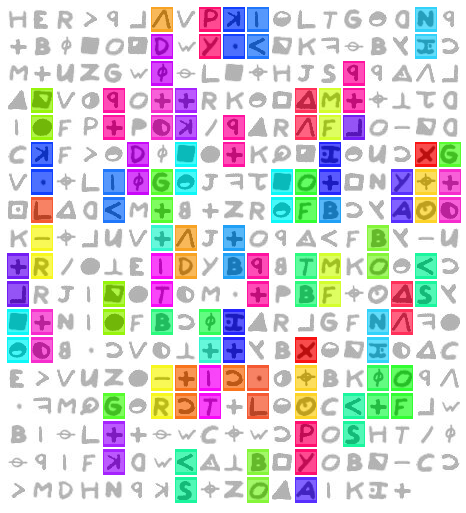
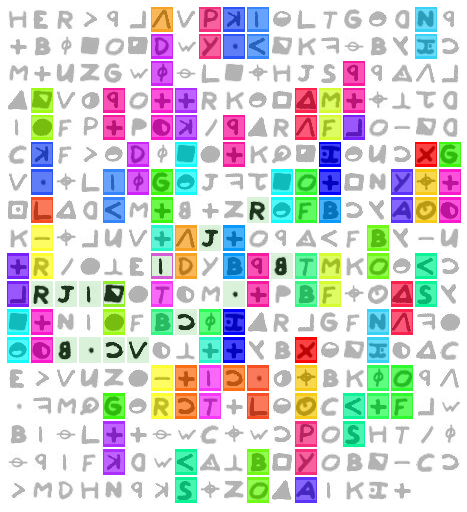
While I’m at it, here’s what the repeating bigrams look like at period 19:
Writing the cipher to 19 columns makes them a little easier to spot:
The "voids" (regions lacking repeating bigrams) seem interesting to me. The seemingly diagonal void in the first image can be seen as a 2 column void in the second image.
And here’s how the pivots appear when the cipher is written to 19 columns:
That looks really cool.
As you can see there is a spike every 10 positions.
However when i plotted the IoC by column width i got a surprise
instead of the IoC dropping it peaked.
…
This was unexpected and so i need to review my code and for no my rule of thumb.
Quick question – why was this surprising? Reason I ask is because: If you know the key "resonates" at multiples of the key length, then writing the cipher to a number of columns that is a multiple of the key length would put more repeated symbols along those columns, thereby increasing IoC for those columns. Or am I wrong?
Also, I am wondering if you can normalize the plot (and filter out the 1/f noise) by calculating mean+std dev for all column widths for many random shuffles. Then, when you calculate avg IoC per column width of a particular cipher, plot the number of standard deviations your column IoC mean is from the shuffles’ mean. It would probably help to better isolate the spikes. I may do something like this when I implement your columnar IoC test to run against my test ciphers spreadsheet so we can see if other ciphers have interesting spikes in colunnar IoC.
Quick question – why was this surprising? Reason I ask is because: If you know the key "resonates" at multiples of the key length, then writing the cipher to a number of columns that is a multiple of the key length would put more repeated symbols along those columns, thereby increasing IoC for those columns. Or am I wrong?
I went through various column widths.
Then for each width i wrote out the cipher and calculated the ioc for each column i.e. for a width of 6 there are then 6 colums and 6 iocs. I then recorded the stdev and average for the width. Moving onto to the next width.
The surprise was the stdev & mean went up not down at the "resonance" points on the virgenere key widths.
At width = key width each column is keyed with the same offset so should have a ioc of the base language. This should be the same for all the column in that width Therefore a low standards deviation would be expected.
Hopefully this makes more sense now?
Also, I am wondering if you can normalize the plot (and filter out the 1/f noise) by calculating mean+std dev for all column widths for many random shuffles. Then, when you calculate avg IoC per column width of a particular cipher, plot the number of standard deviations your column IoC mean is from the shuffles’ mean. It would probably help to better isolate the spikes. I may do something like this when I implement your columnar IoC test to run against my test ciphers spreadsheet so we can see if other ciphers have interesting spikes in colunnar IoC.
Due to the dropping samples (n samples = 340/width) the sample rate is reducing and 1/f I believe is unavoidable But i will give this some more thought.
Edit. I think you have a point that the 1/f can be "cancelled" out by a known model but will still be noisy
Regards
Bart
The "voids" (regions lacking repeating bigrams) seem interesting to me. The seemingly diagonal void in the first image can be seen as a 2 column void in the second image.
David. This is very interesting and was what i was looking at before you mention it.
I wonder what the significance of it is.
Regards
Bart
I made a spreadsheet to convert the strings in column E of the following website spreadsheet to 17 x 20 messages.
https://docs.google.com/spreadsheets/d/ … 1394933925
Then I sorted the website spreadsheet ( not my spreadsheet ) by column B. It looks like a lot of the messages near the top are something else, so I started working my way up from the bottom. There are a few smokie polyalphabetic messages there, but I am particularly interested in the multiobjective evolution messages.
I have only checked a few, but am getting some spikes right away. The message on row 797 has y = 19, and the message on row 794 has y = 18. I will keep checking.
I am finding an interesting trend with the multiobjective evolution messages. I have checked more than a dozen at the bottom of the list when the website spreadsheet is sorted by column B.
Spikes higher than 18 are not difficult to find. But the interesting thing is that the spike often occurs at x = 3. The column chart shows generally higher y values for lower x values, and lower y values for higher x values.
See the message at row 797, or message number 917. There is a y = 19 spike at x =3.
See the message at row 794, or message number 914. There is a y = 18 spike at x = 16.
See the message at row 792, or message number 912. There is a y = 24 spike at x = 3.
See the message at row 788, or message number 908. There is a y = 23 spike at x = 3.
See the message at row 785, or message number 905. There is a y = 19 spike at x = 3.
Maybe these messages are almost all identical. I will have to check that.
Below is message number 908 on the left and message number 912 on the right. They share the same symbols at 125 positions, which I shaded in light purple on the right. They have a lot of low period repeating fragments, boxed in red, which cause the spikes at x = 3. Message 908 coincidence count spike at bottom. I eyeballed the general trend in y values, red sloping line.
I wonder if the variance of the y values, if examined in different ways, would reveal a particular signature for the 340. A way to identify transposition, or whatever, even if not a Vigenere cipher. Variance of y values across the entire chart, or what about variance of y values if looking at smaller sections of the chart. Slope, etc…
The "voids" (regions lacking repeating bigrams) seem interesting to me. The seemingly diagonal void in the first image can be seen as a 2 column void in the second image.
David. This is very interesting and was what i was looking at before you mention it.
I wonder what the significance of it is.
Regards
Bart
Z340 seems to have several such quirky voids and biases, such as:
– The "lower left" repeating bigram void:
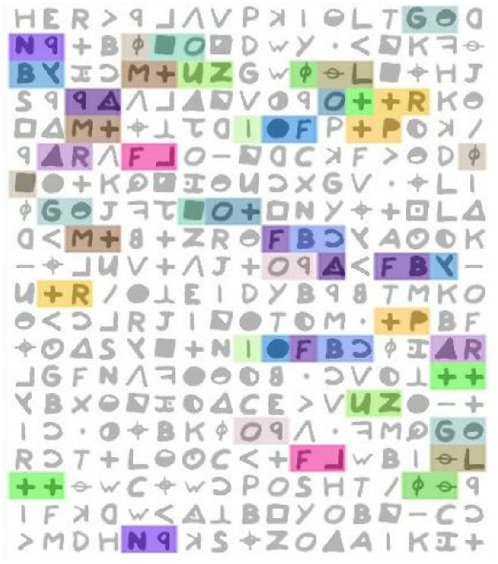
– If you split the cipher in half (top and bottom), the top half has 9 repeating bigrams but the bottom only has one.
– If you remove all even positions, the remaining cipher only has 2 repeating bigrams. But if you remove all odd positions, the remaining cipher has 10 repeating bigrams.
– The top half starts with 3 lines that each have no repeated symbols. The same is true of the bottom half. In total, there are 9 lines that have no repeats. In 1,000,000 shuffles, none had at least 9 lines with no repeats.
Are these features or phantoms? ![]()
This evening I wrote a program to go through every column arrangement from 6 wide to 84 wide.
it then calculated the IoC of each column and then when it had done each column in the width group it calculated the Average and standard deviation for that width group.
I tried to reproduce your data with my own program. It is close but there are some differences. Let’s look at 6 wide:
My per-column IOCs are:
column 1: 0.019423558897243107
column 2: 0.02882205513784461
column 3: 0.02443609022556391
column 4: 0.023809523809523808
column 5: 0.01948051948051948
column 6: 0.02142857142857143
mean: 0.022900053163211056
std dev: 0.0035833262643733157
Yours are:
column 1: 0.019481
column 2: 0.029221
column 3: 0.024675
column 4: 0.021429
column 5: 0.019481
column 6: 0.021429
mean: 0.002423
std dev: 0.000045
Note that the last two are very close. Here are the columnar strings I generated to compute IoC:
column 1: H^Lp%*:Gz73KzF/lk#;VGO+M26UOy5BOJMz+cG24XC53pGLFLzH|7BMS|
column 2: EVT+DKcWH^p2tPpOF52.2+@+F4Vp-tp2|.6N(F4t1E-z^21l+WTFt*DzK
column 3: RPGBWfM(JlO_j+8->+UzJ_LbBK+7UEb<*+9|;Nb+*>+B.R6W+c/kB-HZ;
column 4: >k2(Y)+)S8+9d&R*2KcLfN9+c-^<+|Tc5&S58^.+:V|KfcCB)P(d_CNO+
column 5: p|d#.BULp*+M|4^dDqX|jYdZyzJFRDMlTByFRfcy4Uc(MT<|WO)WYcp8
column 6: l1NO<yZ#pVR+5kFC(%G(#z<RAl+B/YKR4F#Bl5VB9Z.Oq++)CSp<O>kA
Note that the last two are shorter than the rest. I wonder if that accounts for the differences in our IoC values for columns 1 – 4. Here’s my IoC code if you want to compare our algorithms:
public static Double ioc(StringBuffer sb) {
	long sum = 0;
	Map<Character, Long> map = new HashMap<Character, Long>();
	for (int i=0; i<sb.length(); i++) {
		Character key = sb.charAt(i);
		Long val = map.get(key);
		if (val == null) val = 0l;
		val++;
		map.put(key, val);
	}
	Long val;
	for (Character key : map.keySet()) {
		val = map.get(key);
		sum += val*(val-1);
	}
	return ((double)sum)/((double)sb.length()*(sb.length()-1));
}
My plot ends up looking a bit different due to whatever is making our columnar IoCs different.
Note that the last two are very close. Here are the columnar strings I generated to compute IoC:
column 1: H^Lp%*:Gz73KzF/lk#;VGO+M26UOy5BOJMz+cG24XC53pGLFLzH|7BMS|
column 2: EVT+DKcWH^p2tPpOF52.2+@+F4Vp-tp2|.6N(F4t1E-z^21l+WTFt*DzK
column 3: RPGBWfM(JlO_j+8->+UzJ_LbBK+7UEb<*+9|;Nb+*>+B.R6W+c/kB-HZ;
column 4: >k2(Y)+)S8+9d&R*2KcLfN9+c-^<+|Tc5&S58^.+:V|KfcCB)P(d_CNO+
column 5: p|d#.BULp*+M|4^dDqX|jYdZyzJFRDMlTByFRfcy4Uc(MT<|WO)WYcp8
column 6: l1NO<yZ#pVR+5kFC(%G(#z<RAl+B/YKR4F#Bl5VB9Z.Oq++)CSp<O>kA
Note that the last two are shorter than the rest. I wonder if that accounts for the differences in our IoC values for columns 1 – 4.
BartW, I get the same IoC values as you for columns 1 – 4 if I remove the very last symbol from my strings above. Did you mean to ignore the "leftover" symbols?
I checked a block of messages from:
https://docs.google.com/spreadsheets/d/ … 1394933925
I started at message 91 and stopped at message 218. It was a convenient block of messages with 340 symbols. I may check some of the messages above, but a lot of them are of different lengths. Some of the messages in the block are multiobjective evolution messages, but I stopped at 218 when all below are multiobjective messages. There are a lot of different types of messages that I checked in the block, made by several different people to test a lot of different ideas.
So out of 128 messages, there were 9 ( 7% ) with spikes of 18 or higher. Left column is message number, right column is spike y value.
202 18 Smokie treats: hillclimber results for the Purple H experiment, message with only perfect cycles
203 20 Smokie treats: Perfect cycles + 3 high count 1:1 substitutes + 4 medium-high count wildcards/polyalphabetic symbols: smokie.txt (before masking)
222 24 Smokie treats: Bigram repeat period 19 emulation attempt without transposition: smokie18a.txt
301 19 daikon test cipher 2
302 20 daikon test cipher 3
318 18 doranchak: multiobjective evolution cipher 1
329 18 doranchak: multiobjective evolution cipher 3
337 22 Jarlve mimic homophonic substitution using addition and modulo functions
338 23 doranchak multiobjective evolution experiment 50 generation 12100 cipher 1
Doranchak, thank you for making the spreadsheet and keeping track of everyone’s messages. That is a lot of work and I appreciate it. It came in handy today.
Bart, thanks for showing me the coincidence count method. Note that message 306 is a homophonic Vigenere made by glurk, and if you make a coincidence count chart, you will see that the keyword is length of 7. I sort of like that one, and wonder how it could be solved.
1 2 3 4 5 6 7 6 8 9 10 11 12 13 14 15 16
17 10 18 19 20 21 16 22 1 6 23 24 25 26 27 10 28
29 30 31 15 23 32 12 33 34 28 35 27 1 14 36 6 37
16 36 38 17 8 23 39 40 39 41 9 11 8 15 20 30 3
13 42 43 18 39 25 34 1 41 26 10 44 6 12 6 45 17
11 3 18 3 13 30 44 18 46 22 3 14 17 34 47 44 42
4 33 1 8 18 18 9 42 17 47 15 48 3 49 42 50 30
48 41 20 3 43 28 3 26 13 6 39 48 39 17 24 29 34
11 4 17 12 19 16 27 39 40 26 44 18 8 16 44 35 34
16 12 8 26 35 13 12 51 33 28 52 27 52 23 50 28 25
9 18 45 12 19 49 51 17 30 33 51 9 1 15 53 27 1
12 4 46 36 10 2 33 23 33 2 19 3 22 41 28 50 28
35 52 36 7 24 51 7 28 30 54 4 8 11 8 15 44 32
46 47 23 54 25 23 33 10 14 51 39 39 53 37 48 48 20
46 25 52 28 19 14 35 26 48 45 37 44 24 8 13 8 53
37 32 24 37 15 14 11 35 13 24 36 6 35 46 54 38 12
9 1 9 3 49 42 32 29 6 41 45 45 5 48 13 3 13
6 35 15 14 20 46 18 18 8 9 28 7 45 52 16 17 52
18 7 45 51 16 53 14 38 46 19 15 31 27 27 48 33 2
26 23 31 38 19 19 8 15 23 2 47 32 8 44 39 13 35
Take a look at different directions, including this version, reading left to right. I would be interested in your appraisal.
